By Infinium Global Research
Aug, 2020
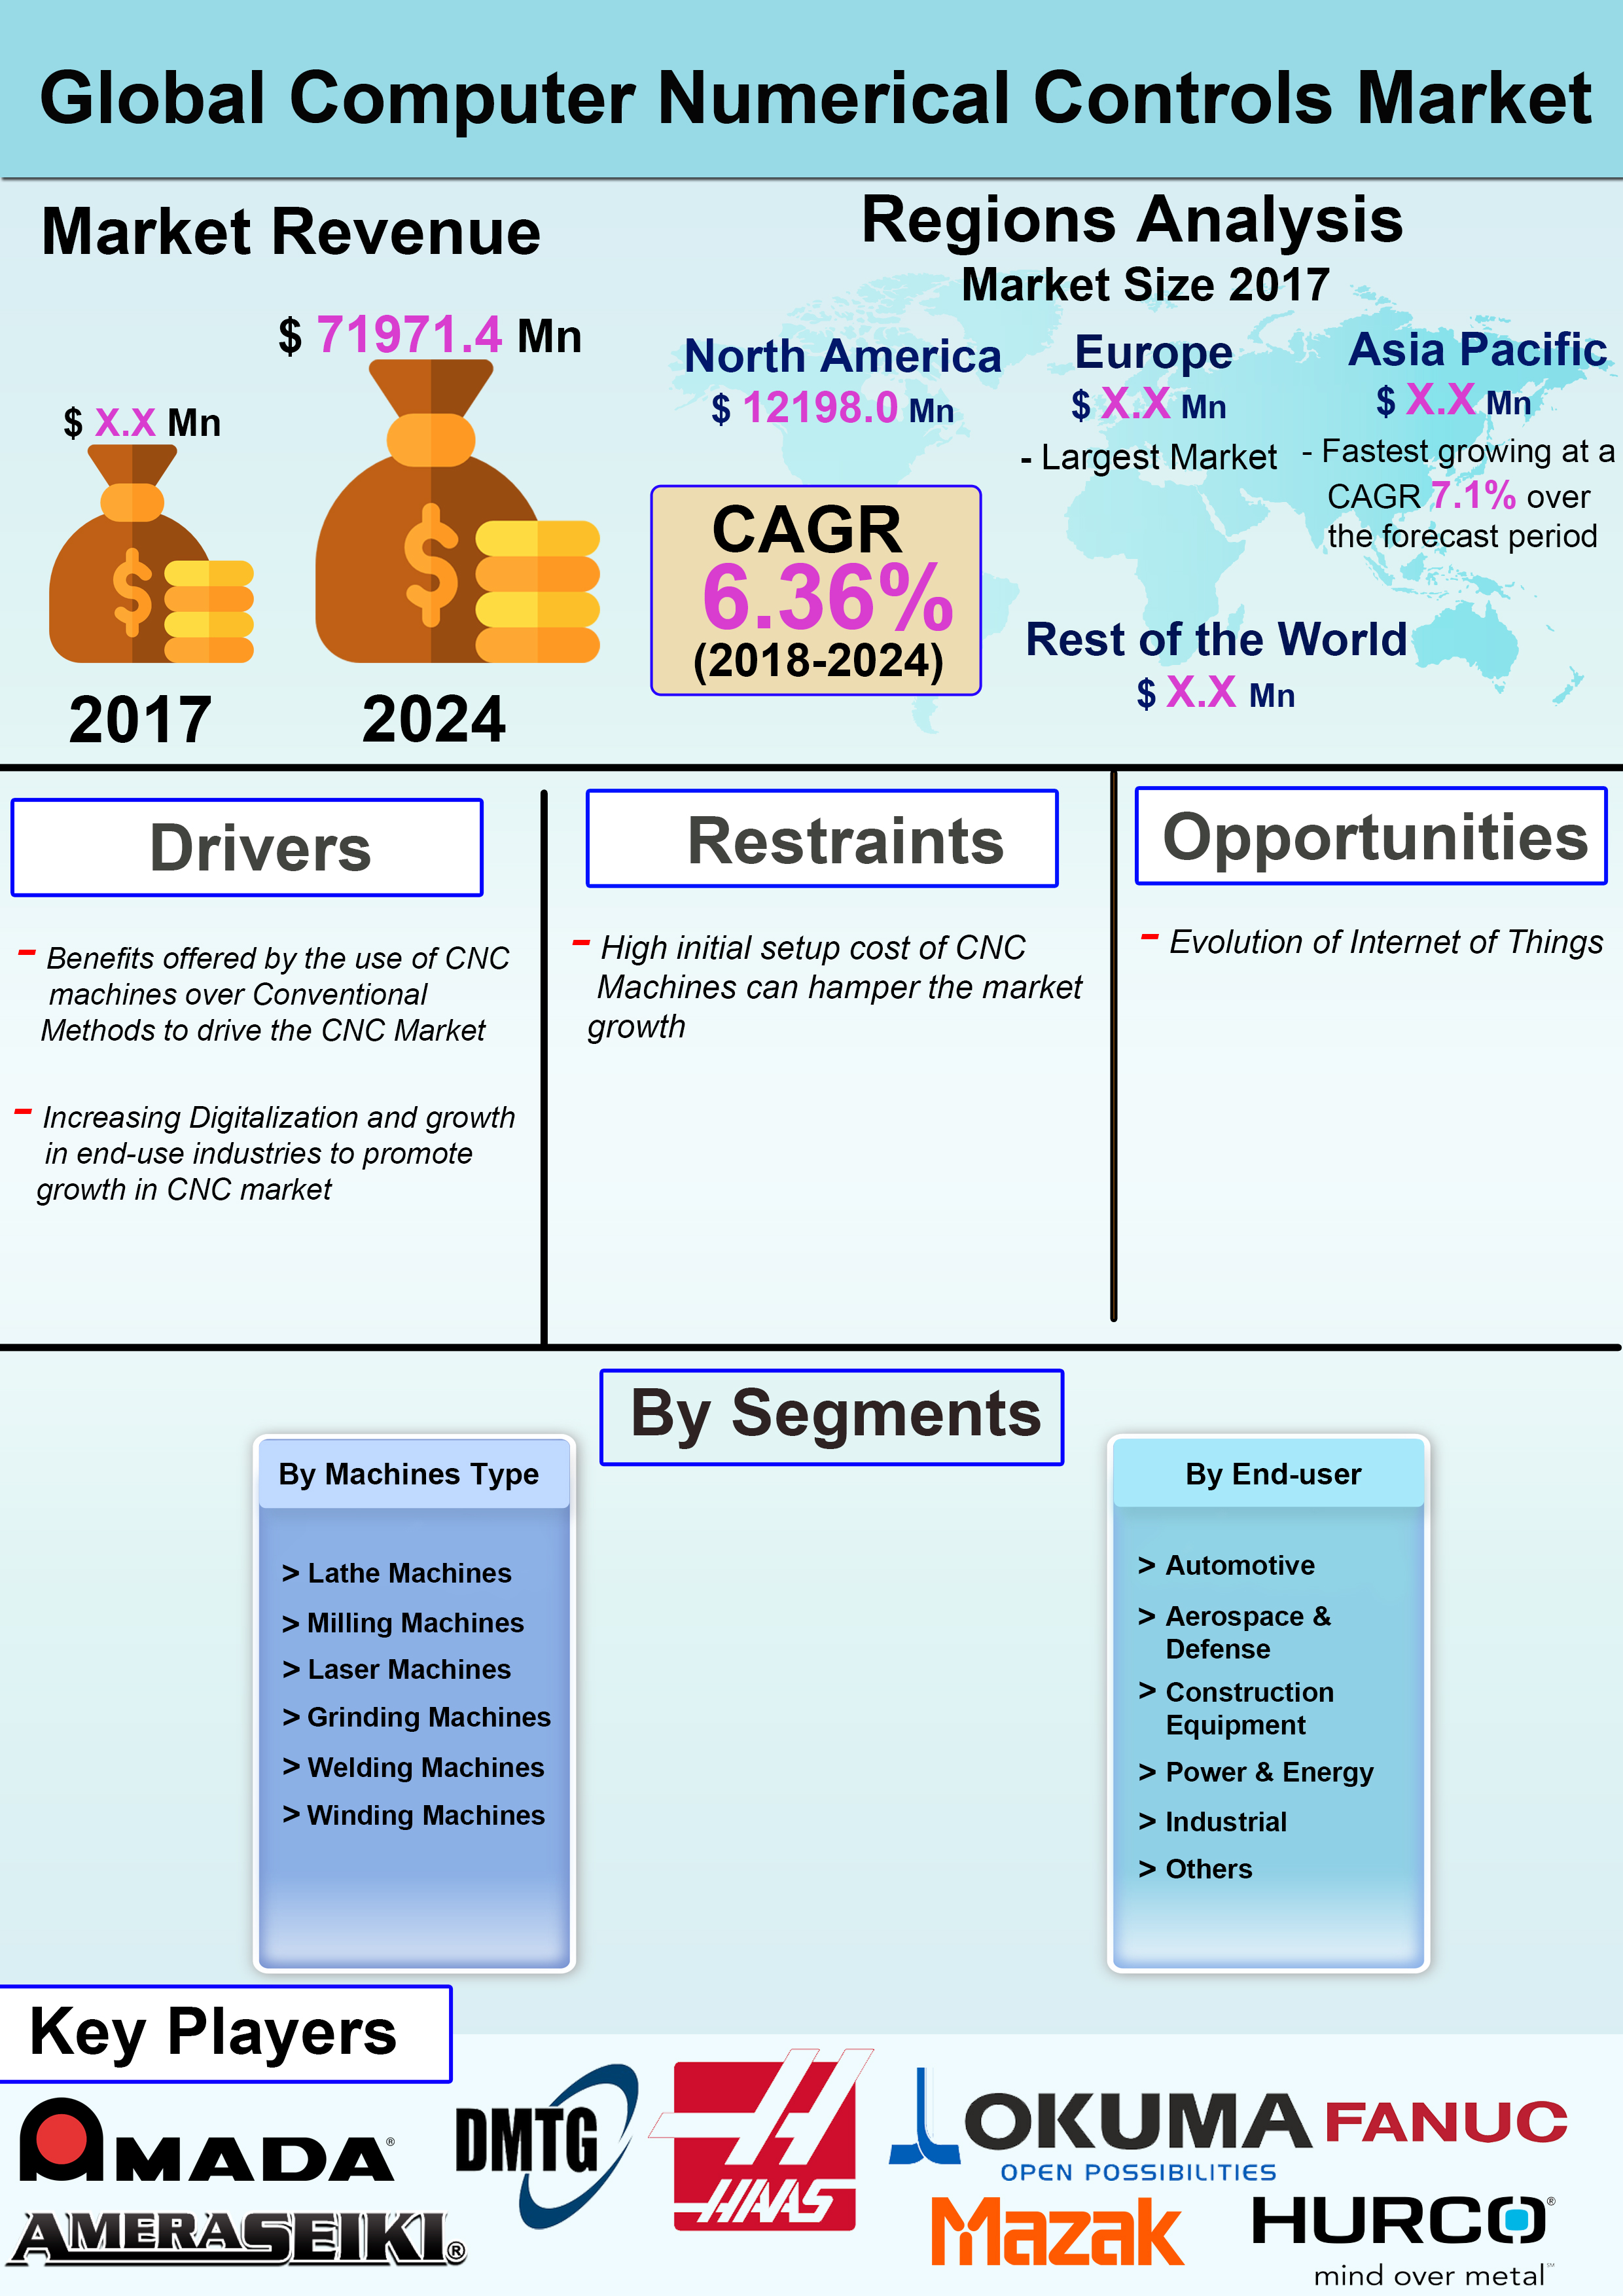
Computer numerical controls is a process used in the
manufacturing sector in which pre-programmed computer software is used to
control the machine tools. Increasing advancement in the production technology
has led to the reduction in time required for manufacturing components with
better finish quality is anticipated to be the factor driving the growth of the
computer numerical control market. Speed, production rate, and accuracy are
some of the main advantages of CNC machining over conventional machining that
reduces human errors. Additionally, an increase in demand for mass production
plants in various sectors including defense and intelligence, electronics, and
automobiles are fuelling the growth in the computer numerical control market.
Moreover, increasing efforts to cut down the expenses experienced in employing
operators for individual machinery are anticipated to boost the growth of the
computer numerical control market. However, the high cost of maintenance and after
sales services of computer numerical control machines are anticipated to hamper
the growth of the market over the forecast period.
The
report on Global Computer Numerical Controls Market covers segments such as
machines type and end-use. The report provides regional analysis covering
geographies such as North America, Europe, Asia-Pacific, Rest of the World In
this section, the key trends and market size for each geography are provided
over the period of 2016-2024. The report provides profiles of the companies in
the global Amada Co., Ltd., DMTG Corporation, Haas Automation, Okuma
Corporation, Yamazaki Mazak Corporation, Amera Seiki, Hurco Companies, Inc.,
Shenyang Machine Tool Co., Ltd. (SMTCL), Hurco Companies, Inc. and FANUC
CORPORATION.
An infographic is a collection of imagery, data visualizations like pie charts and bar graphs, and minimal text that gives an easy-to-understand overview of a topic. As in the example below, infographics use striking, engaging visuals to communicate information quickly and clearly
Infographics have become increasingly popular because of their ability to quickly convey large amounts of information in an appealing package.
An infographic (information graphic) is a representation of information in a graphic format designed to make the data easily understandable at a glance.People use infographics to quickly communicate a message, simplify the presentation of large amounts of data, see data patterns and relationships, and monitor changes in variables.
The process of creating infographics is sometimes referred to as data visualization. Designers start by researching the topic and gathering data and then organizing it into a visual format. This can include creating charts, graphs, maps, timelines or other visuals to help tell the story.